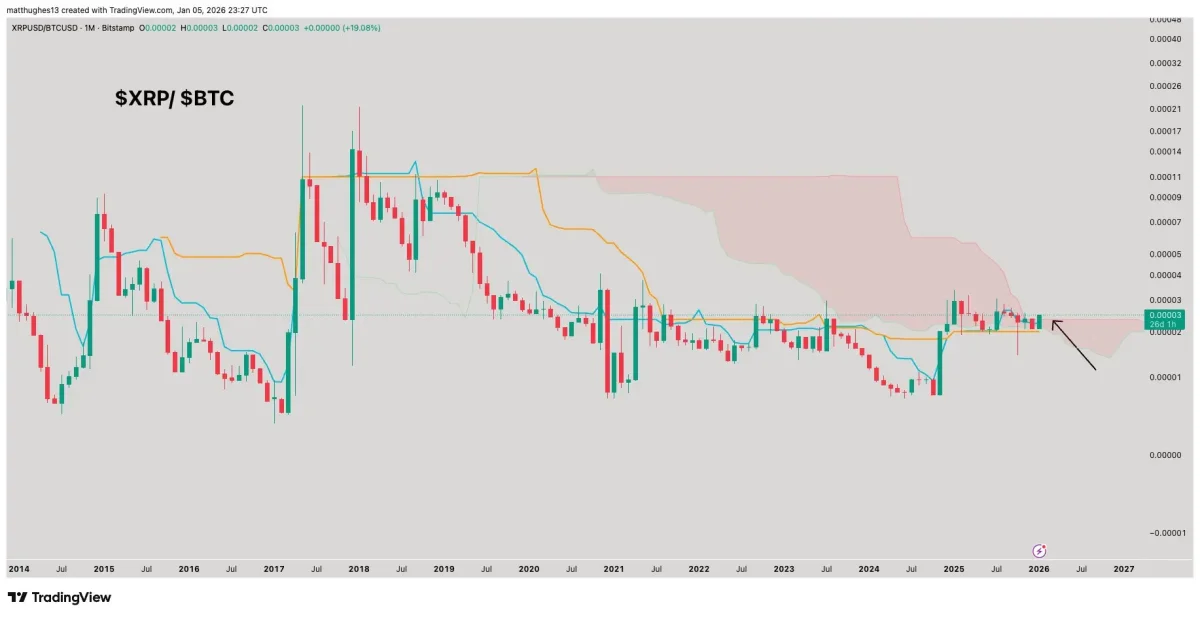
Traders are getting louder about XRP versus Bitcoin because two things are lining up at once: a rare monthly Ichimoku cloud breakout attempt on the XRP/BTC ratio (the first since 2018) and heavy early-January activity in XRP. It’s not a “price must go up” signal—it’s a sign the market may be shifting where it prefers to put marginal risk.
That’s why the focus is on relative strength. If this holds and confirms on the monthly view, the implication is simply that XRP may attract stronger buying on dips than BTC does—not that XRP is guaranteed to rally in a straight line.
Why the Chart Crowd Cares Right Now
On the XRP/BTC chart, the monthly Ichimoku cloud breach attempt is the headline because it’s rare. A chartist quoted in market reports called it “profoundly bullish” for relative performance, basically treating it like a regime-change setup. Other signals were said to be moving in the same direction: RSI showed breakout behavior, shorter timeframes printed bull-flag patterns, and buyers were described as defending trendlines that previously capped declines.
Then came the gut-check move on January 6. XRP flushed hard on high volume, briefly tagging $2.21, and then snapped back as buyers stepped in—something observers interpreted as a capitulation-style shakeout that cleared weaker positioning. In plain terms: the market tried to break it, and it didn’t stay broken.
The Levels and the Flow Story
The structure is clean enough that most traders are using the same map. $2.21 is the line in the sand, $2.31–$2.32 is the first real ceiling, and $2.39 is the overhead supply zone that could trip momentum if it gets there too quickly. Holding $2.21 keeps the “shakeout then bid” narrative alive. Reclaiming $2.31–$2.32 is the step that would make the breakout talk feel less like hype and more like follow-through.
Performance has helped the story catch fire. Market reports had XRP up about 24% year-to-date as of January 7, versus about 5.5% for Bitcoin. That gap is exactly the kind of backdrop where an XRP/BTC breakout attempt starts to matter. And the flow narrative adds fuel: the same coverage cited roughly $1.3 billion of inflows into XRP ETFs since November, which gives the move an institutional “bid” storyline instead of only a retail-momentum one.
What Would Make This Stick—or Fade
Price targets floating around are all over the place, from near-term multi-dollar objectives to much more speculative long-term calls. Bank research was cited with an $8 target, and others have referenced a $10 end-2025 target, but both were framed as dependent on regulatory clarity and continued inflows. So the market isn’t treating targets as destiny—it’s treating them as scenarios. Flows and structure decide which scenario survives.
Bottom line: this is a relative-strength bet with real-world constraints. A confirmed monthly Ichimoku break would increase the odds of continued XRP outperformance, but it doesn’t remove the risks that end these trades—liquidity shocks, liquidation cascades, and macro volatility. That’s why the next checkpoints are simple: does XRP keep $2.21, can it reclaim $2.31–$2.32, and do the reported ETF inflows keep showing up?